
.png)

Ask your pharmacy a question. Get the report in minutes.
Tabz Insights turns the orders, payments, prescriptions and patients already in Tabz into answers and reports. Ask in plain English, share what matters with your team, and get the week's numbers in your inbox.
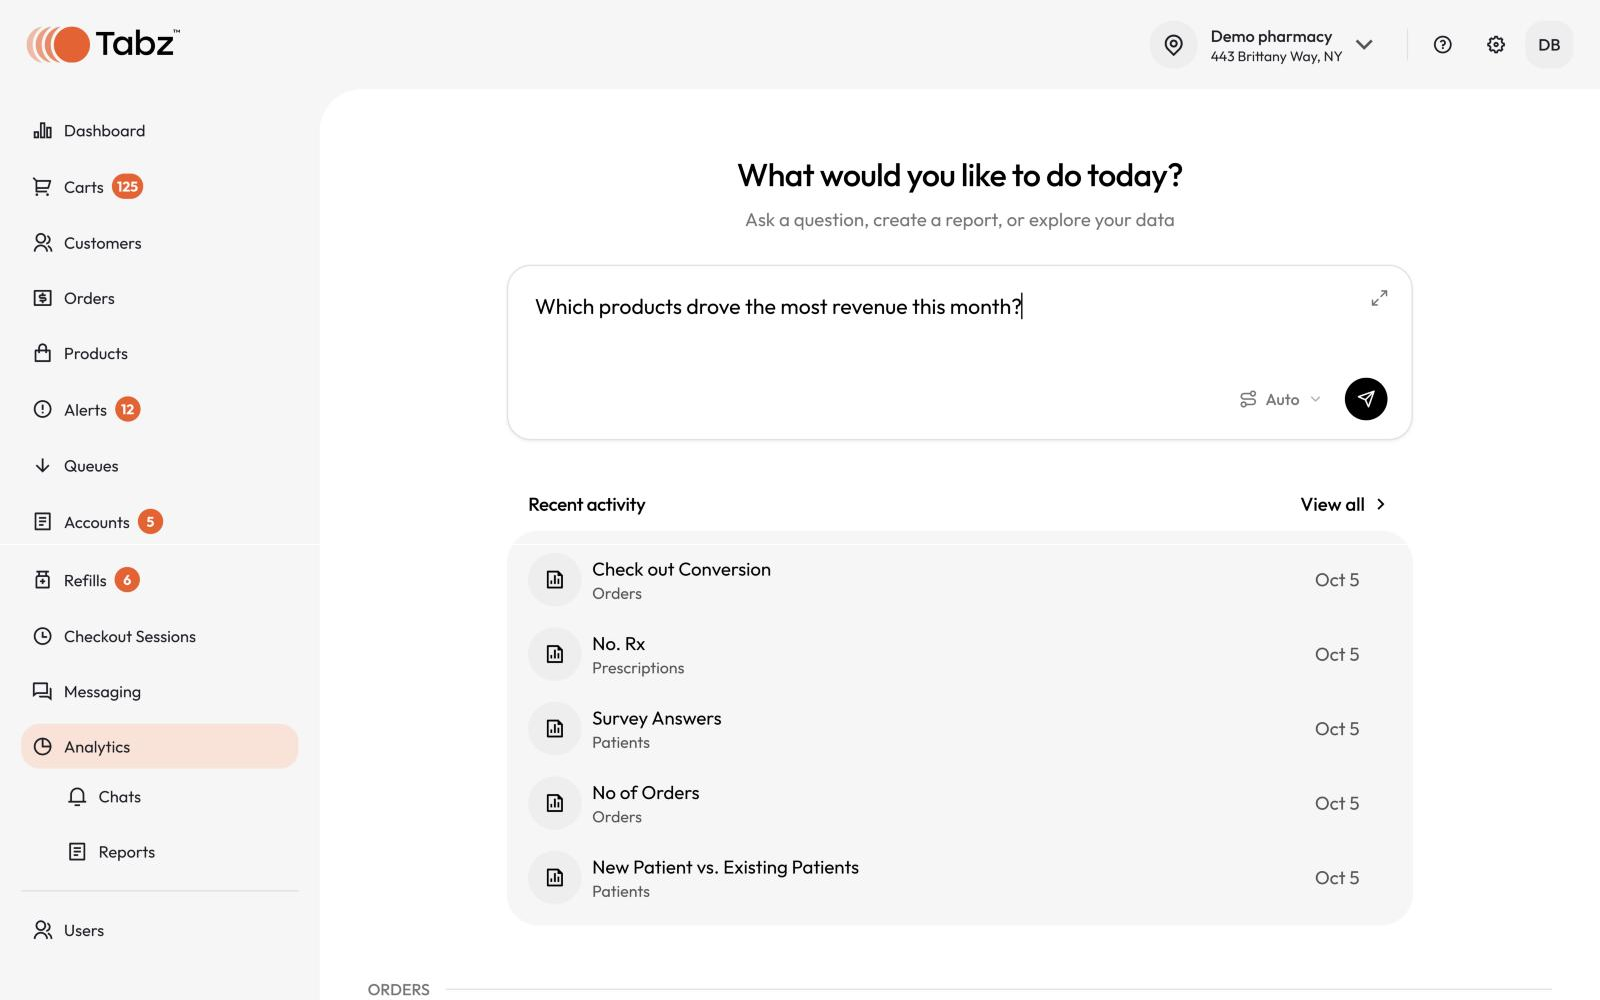

Nothing to set up
It runs on the data already in Tabz.

Same login, same permissions
Only roles with Analytics access can see it.

Right in your dashboard menu
Open Analytics in Tabz and start asking.
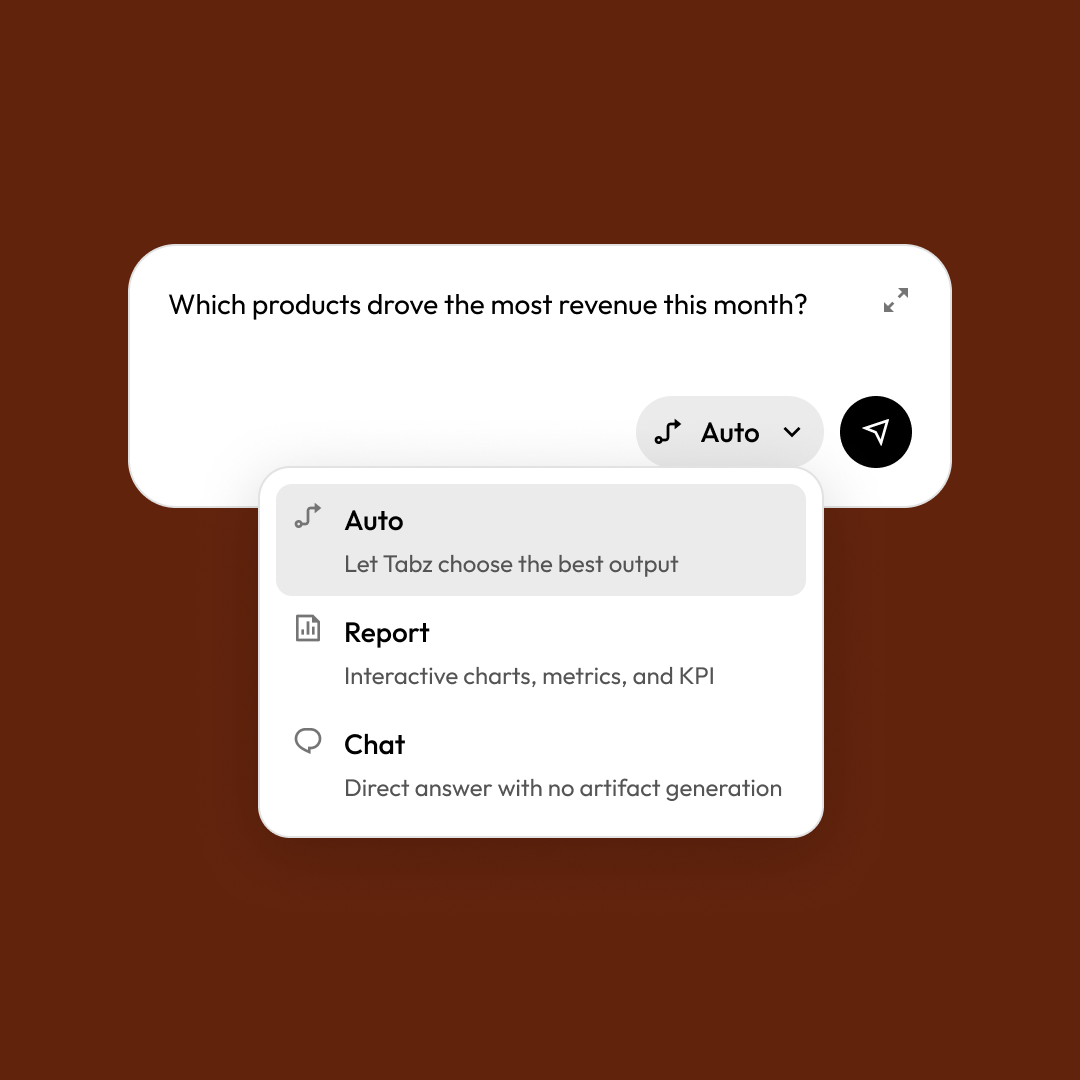
Ask it the way you'd ask your team.
Type a question like "Which products drove the most revenue this month?" Tabz Insights pulls the numbers, builds the chart and shows the data behind it. Choose Report for charts and KPIs, Chat for a quick answer, or leave it on Auto and it picks for you.
How many orders did we take last week, compared with the week before?
How long do patients take to pay this month?
Which products sold the most in September?
What share of this month's prescriptions were refills?
How many carts turned into paid orders, by text and by email link?
How much sales tax did we collect last quarter?
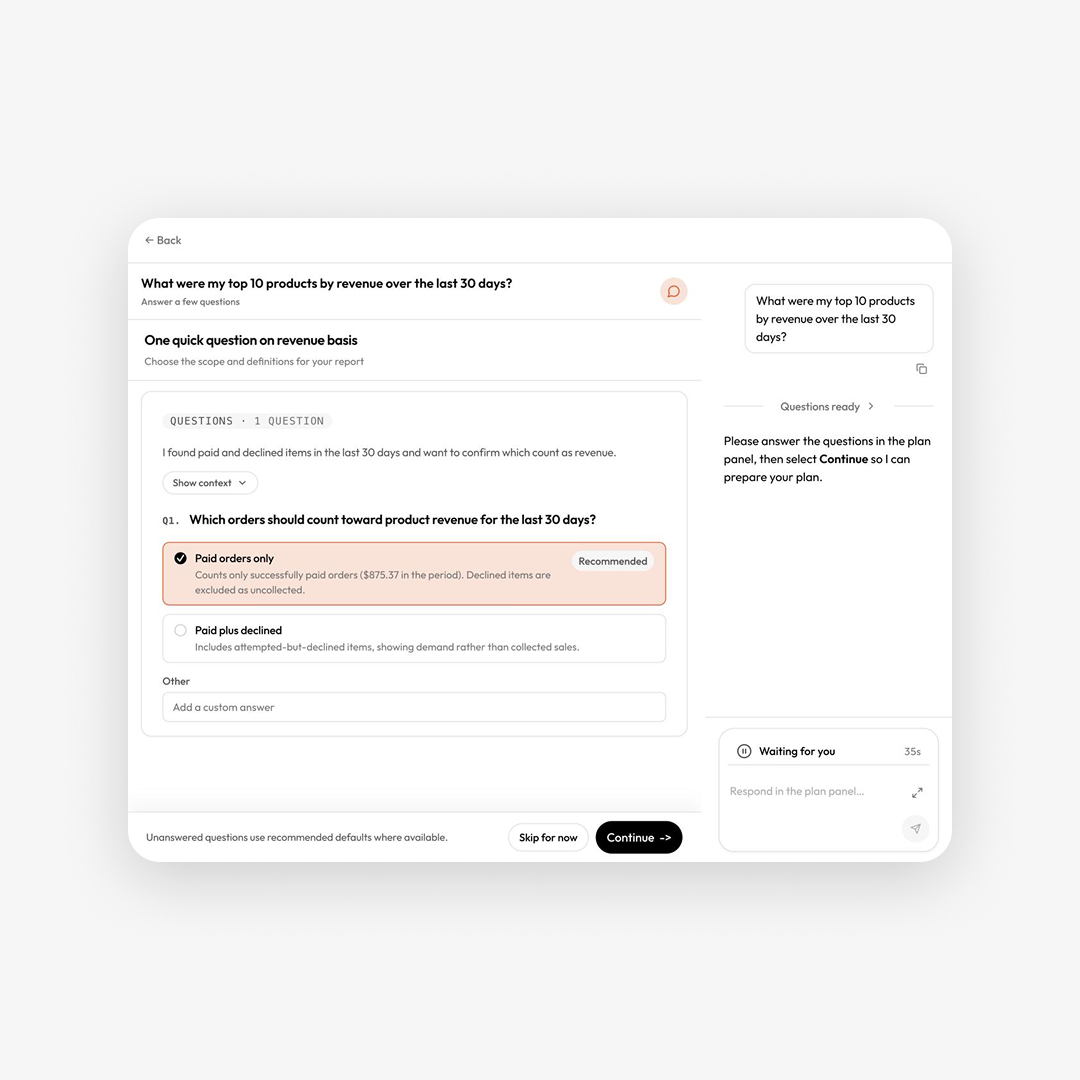
It checks before it answers.
When a question could mean two things, Tabz Insights asks before it builds. Should declined orders count toward revenue? Should refunds? Your answer sets the definition the report uses.If something looks off, flag it right from the report.
Reports for the questions pharmacies ask most, ready on day one.
Open Analytics and these are waiting, built on your own Tabz data.
.png)
Orders and sales
Transaction Report
Orders over time, growth against the prior period, average orders per day
Best-Selling Products
Top products by units sold or revenue
Products Sold and Sales Tax
Every product sold, with its sales tax and totals
Checkout Conversion
How many carts become paid orders, by text and email link

Payments
Payment Volume
Revenue collected, the Rx and non-Rx split, sales tax collected
Time to Pay
Time from order to payment, and the share paid within 24 and 72 hours

Patients
New vs. Returning Patients
First-time and returning patients each period
Patient Repeat Frequency
How often patients come back, and the days between orders
Patient Lifetime Value
Average and median lifetime revenue per patient
Survey Answers
Patient survey responses, summarized by question
Prescriptions
Prescriptions Sold
Rx count, Rx revenue and average Rx price
Refills vs. New Prescriptions
The refill share of all prescriptions over time
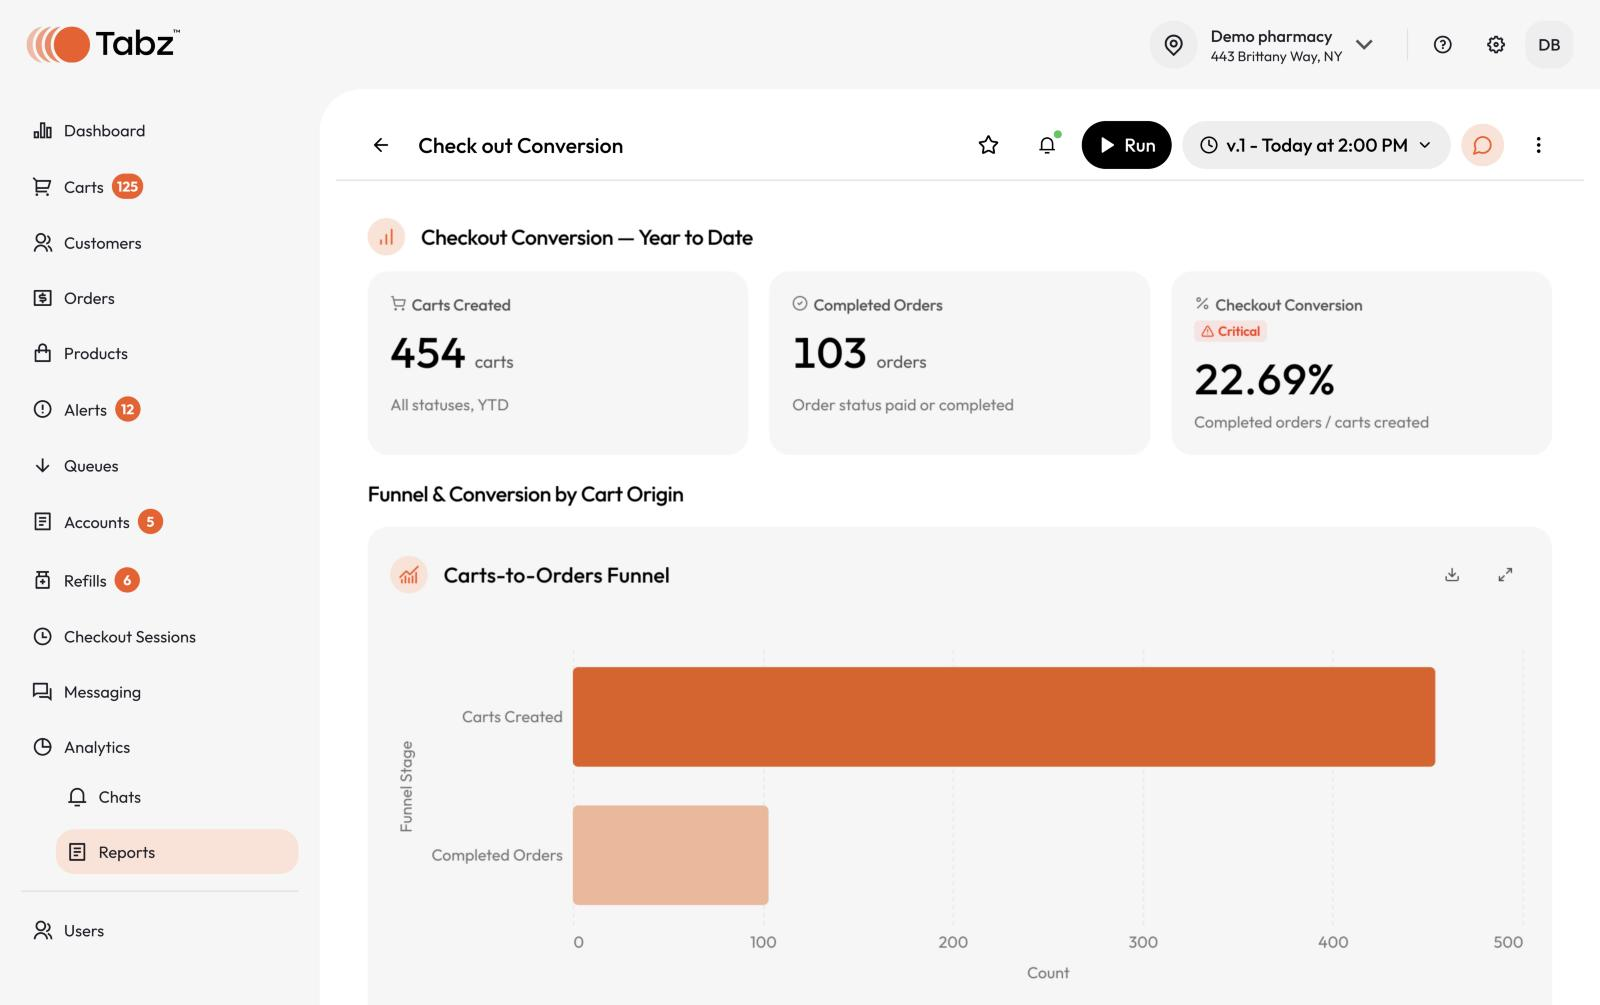
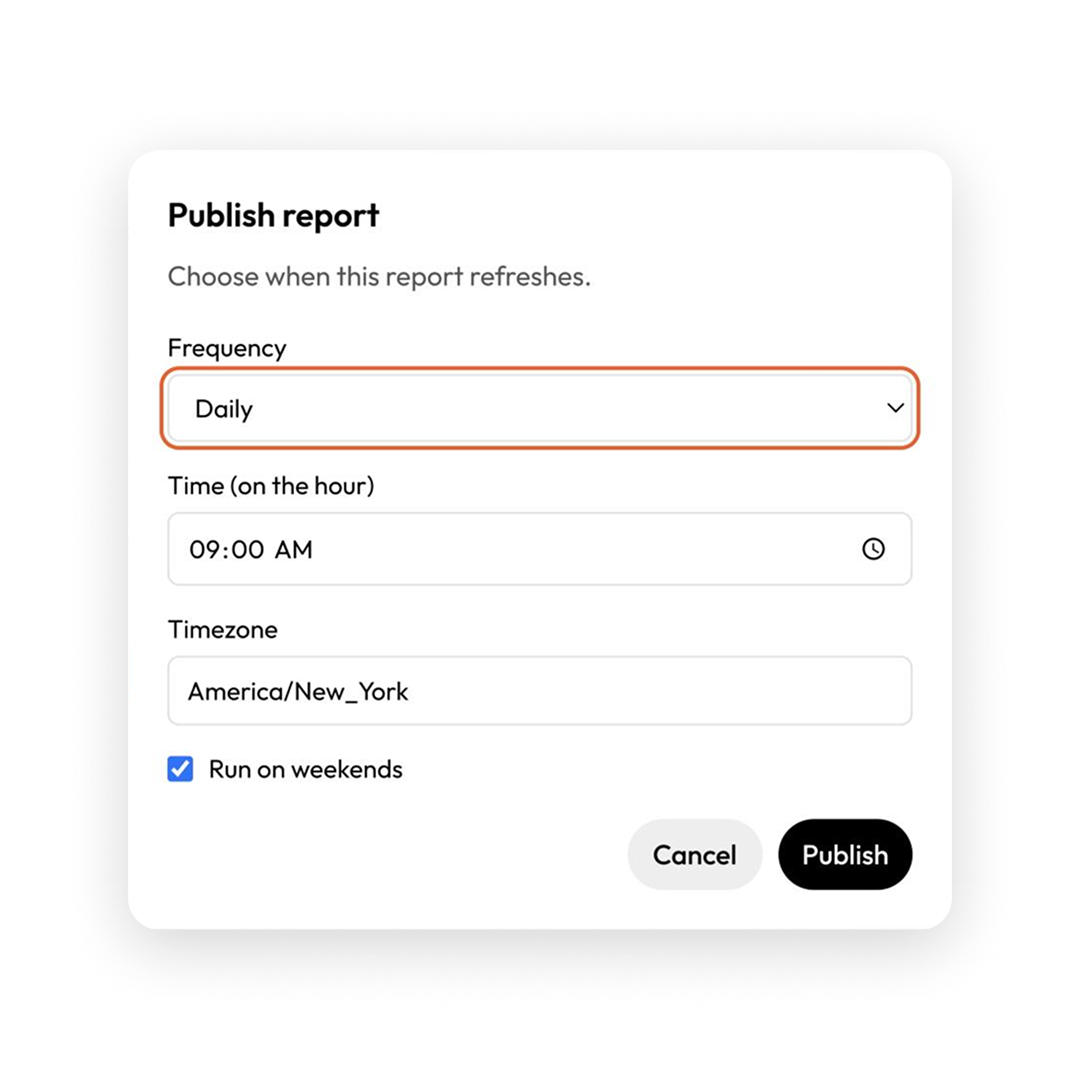
Publish once. Your team sees it every day.
Reports you build start as private drafts. Publish one and everyone at your pharmacy with Analytics access can open it. You pick how often it refreshes, so the numbers are current when your team looks.Need it outside Tabz? Export any report as a PDF for your accountant or your partners.
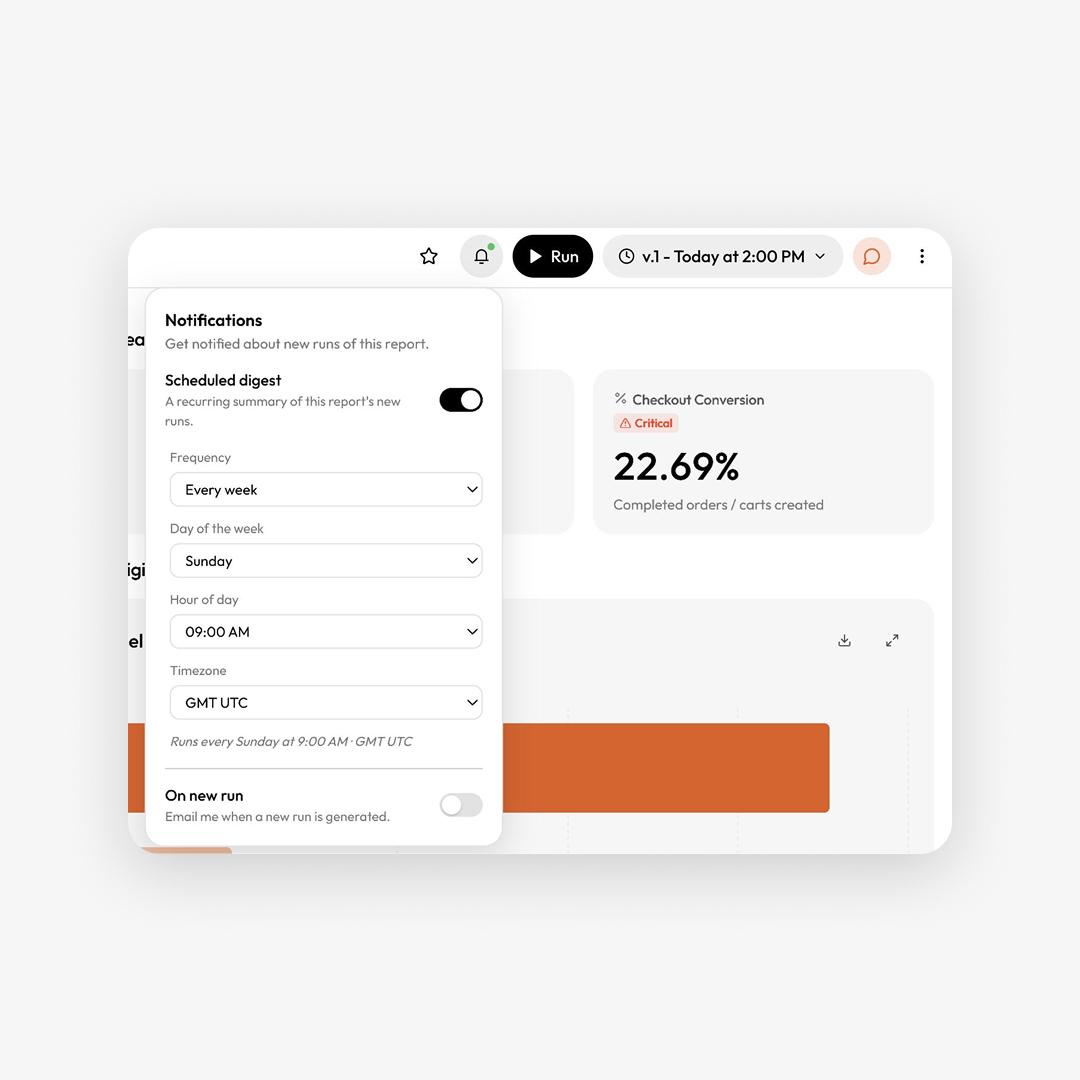
Your week in review, in your inbox.
Turn on a weekly digest for any published report and pick the day and hour it arrives. Each digest leads with what changed, puts last week's numbers next to the week before, and links straight back to the full report. A PDF comes attached.
Get early access.
We're opening Tabz Insights to a small group of Tabz pharmacies first, so we can tune it on real pharmacy questions. Request early access and our team will reach out when your spot opens.
Not on Tabz yet? Book a demo and we'll show you Tabz and Insights together.
Frequently asked questions
Pharmacies on Tabz. Inside your pharmacy, anyone whose Tabz role includes Analytics access. Technicians don't have it by default.
No. Your reports only ever show your pharmacy's data.
Request early access above. We're adding pharmacies in small groups.
The orders, payments, prescriptions, patients and products already in your Tabz account. There's nothing to upload or connect.
Click Report issue on the report. It goes straight to our team.
No. Once your pharmacy is turned on, Analytics shows up in your Tabz menu with the ready-made reports inside.
We'll share pricing before Tabz Insights is generally available. Pharmacies on the early access list hear first.